An informational Windows event is easy to dismiss.
Repeated across a server fleet, it’s a different kind of signal.
This investigation began with recurring activity in DrainCtl’s Event Spikes view, evtSpike. The System channel showed a pattern worth following. The finding wasn’t an outage or a confirmed security incident. It was approximately 402.66 GiB of registry-hive copy data, spread across the Windows servers we reached.
The event’s severity wasn’t the point. The repetition was, and so was what the surrounding evidence showed.
The first clue: an ordinary event, an unusual pattern
The records had these properties:
- Channel: System
- Provider: Microsoft-Windows-Kernel-General
- Event ID: 16
- Message match:
OesisHiveCopies
On its own, Event ID 16 is informational. Its presence doesn’t establish a scanner failure.
But recurring messages that referenced the same family of registry-hive paths raised a practical question:
What was repeatedly touching these hives, and what was being left behind?
DrainCtl supplied the detection cue. Scoping it took separate host-level checks.
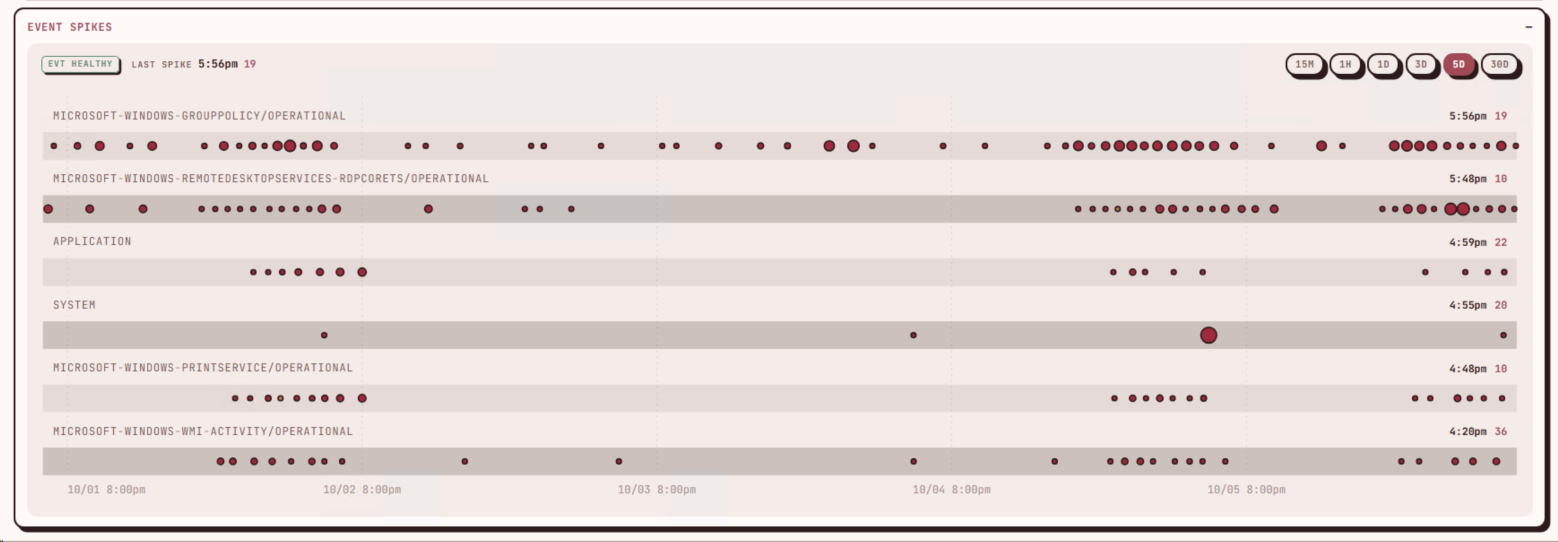
Reference screenshot supplied for the illustration. It’s separate from the September 26 investigation measurements. Its dates and displayed counts weren’t used to get the article totals.
Following the path into Windows Temp
We looked at directories matching:
C:\Windows\Temp\OesisHiveCopies_*
We also checked scanner presence, available component-version information, Authenticode signatures, matching Windows events, and the current software-scanner log.
The read-only collection reached all 49 servers. Here’s what it showed:
| Finding | Measured result |
|---|---|
| Servers reached | 49 |
| Servers with the scanner installed | 48 |
| Servers missing scanner coverage | 1 |
| Informational Event ID 16 matches | 75,725 |
| Hive-copy directories | 1,174 |
| Files, counted recursively | 1,806,412 |
| Total size | approximately 402.66 GiB |
| Servers holding 5 GiB or more | 13, together about 93% of the total |
| Largest single host | approximately 91.72 GiB |
Current logs matching -94 OR corrupted logged-out user wording | 7 (matched branch unknown) |
Some of those numbers need context.
The 75,725 event matches are a sum of per-host rolling 26-hour windows. The windows aren’t synchronized across hosts. So it isn’t a single fleet-wide 26-hour count.
For the seven log matches, we know a current log hit either the -94 text or the corrupted logged-out user wording. We don’t know which of the two matched, and we don’t know the branch for any individual log.
The recheck that corrected the zeros
The first pass reported zero files and zero bytes on some hosts, even though the directories were present. Recursive rechecks corrected those zeros on 11 of 12 hosts.
We haven’t established why the initial count read zero. The recheck corrected the readings. It didn’t explain them.
One corrected host came out above 35 GiB. That’s a big change from a zero.
Events and storage measure different things
The storage measurements themselves were taken at different times. The events were gathered separately too. The aggregate is an operational snapshot of canonical host measurements, not one synchronized measurement.
The dimensions also differ in practice. One host held 43.10 GiB of hive copies but showed only 157 matching events.
A count within a window isn’t necessarily a burst count. Recent event volume and hourly burst concentration are separate views. Some other servers qualified for investigation because of concentrated hourly bursts, not because their overall counts were large.
Accumulated storage, recent events, current-log failures and component presence are separate dimensions. They don’t add up to one health score.
So a high event count doesn’t predict high storage. Low events don’t rule out a large footprint either.
Where the data sits
The size isn’t spread evenly. Thirteen servers at 5 GiB or more hold about 93% of the roughly 402.66 GiB. The largest host holds approximately 91.72 GiB by itself.
The total comes to 1,174 directories and 1,806,412 recursively counted files.
What the logs can and can’t tell us
The negative results aren’t equal across hosts.
Some current logs were searched in full. Others were searched only as capped tails. Old logs weren’t content-searched at all.
So “no match” on one host doesn’t carry the same weight as “no match” on another.
The coverage gap
One server was missing scanner coverage. Here’s exactly what we observed there:
- no component root
- no current log
- no matching events
- no matching storage
The expected scanner root and current log are missing. So its zero events and zero storage are a scanner-coverage gap. They aren’t evidence of successful scanning.
What the pattern suggests
The leading inference is a registry-hive workflow involving OESIS under N-central. It’s an inference only. It isn’t a vendor-confirmed defect.
One hypothesis is inconsistent completion or cleanup, potentially involving logged-out-user handling. That’s a leading inference from converging evidence. It isn’t seven verified wording hits. The seven logs matched -94 OR the logged-out-user wording, and we can’t say which branch any single log hit.
Another tentative hypothesis: repeated invocation could amplify event activity and leave additional temporary material. That’s conditional. It’s unproven. It isn’t established causation.
We haven’t proven the exact vendor code path. We also haven’t shown it’s one defect behind every host’s footprint.
And finding these directories doesn’t prove each one is orphaned or safe to delete.
What we checked on the binaries
Among the binaries we checked, we saw no signature failures. That’s scoped to the checked binaries only. It isn’t proof that the runtime behaves correctly.
What we didn’t do, and what we didn’t show
This was read-only. We didn’t clean anything up. We didn’t make registry or service changes. We didn’t attempt a repair.
The evidence didn’t demonstrate an outage, data loss or security compromise. That’s different from saying we proved their absence. This investigation just wasn’t built to show that.
Proposed next steps
These are proposals. None of them has been carried out.
- Preserve fresh evidence before anything changes on the affected hosts.
- Get vendor guidance on the OESIS and N-central behavior behind these hive copies.
- Restore the missing scanner installation on the one server without coverage.
- Pilot a supported remediation before expanding it fleet-wide.
Cleanup is a separate question. It would need its own verified inactivity rule first.
The takeaway
The repeated informational event was a detection cue. Host-level checks then measured the scope: directories, files, size and distribution across servers.
The cause remains unproven. This article keeps the measurements and the open questions apart on purpose.